使用者介面 (User Interface)
透過 UI 上選擇 View -> Strategy Tester 或快速鍵 Ctrl + R 可叫出以下回測系統的窗口。
測試設定頁面 (Settings)
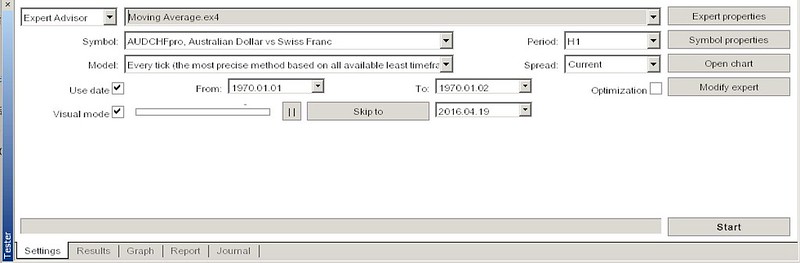
(Reference 官網說明)
- Expert Advisor 最左上方提供兩欄下拉式選單, 可供選擇目前測試的是 EA or Indicator (指標), 在另一個選單中可進一步選擇測試的項目為何, 以上圖為例是 EA 中的 移動平均演算法測試 (Moving Average)
- Symbol 交易商品的選擇
- Period 使用的時間週期(框架), 回測可選用的週期有 M1、M5、M15、M30、H1、H4、Daily
- Model 選擇的價格模型
- Every tick (based on all available least timeframes with fractal interpolation of every tick)
- Control points (based on the nearest less timeframe with fractal interpolation of 12 control points)
- Open prices only (fastest method to analyze the bar just completed)
- Spread 歷史資料內僅含 Bid (買入價, 買方為交易商), 所以需要設定點差 (買入與賣出的價差, 一般用即時的點差做設定)
- Use date 指定測試的時間範圍
- Visual mode 是否要視覺化交易的過程
- Skip to 可以設定將視覺化的交易過程直接跳躍至該日期
- Optimization 可以最佳化不同的參數 (input) 來測試相同的歷史資料 官網介紹
- Expert properties 查閱 EA 的屬性, 可做一些輸入參數的修改 (input) 與最佳化的設定
- Symbol properties 查閱商品的屬性
- Open chart 待補充
- Modify expert 開啟 MetaEditor 編輯器來修改 EA
- Start 開始測試 或 作最佳化
標籤頁介紹
除了 Setting 以外, 在開始測試後會出現其餘四種標籤頁, 分別如下
- Result 會顯示出交易過程中買賣的資訊, 紀錄成交紀錄
- Graph 利潤曲線
- Report 測試-統計報告
- Journal 交易過程中產生的所有資訊, 包含打印出的訊息都會顯示在該分頁